Sharpe ratio explained: the one number that can change how you judge mutual funds
Only 1 in 5 mutual funds achieved a Sharpe ratio of 1.0+ in 2024. Learn what the Sharpe ratio really means, how to calculate it with a simple example, what counts as a "good" number, and how to use it alongside Sortino ratio & rolling returns for smarter fund selection.
In 2024, 62.4% of funds with at least five years of history had a positive Sharpe ratio — and only about 1 in 5 reached a Sharpe of 1.0 or higher. That gap between "good returns" and "good risk-adjusted returns" is exactly why the Sharpe ratio matters before your next mutual fund investment or SIP decision.
Key takeaways
At a glance
Question | Short answer |
|---|---|
What is the Sharpe ratio in simple terms? | How much extra return a portfolio generates per unit of risk (volatility) taken. Higher Sharpe = better risk-adjusted returns. |
Why should mutual fund investors care? | Two funds with the same 5-year return can have completely different Sharpe ratios — one was a smooth ride, the other a roller coaster. |
What is a "good" Sharpe ratio? | Roughly: below 0.3 is weak, 0.3–0.6 is reasonable, 0.6–1.0 is strong, above 1.0 is very strong — but always compare within the same category and time frame. |
Is Sharpe ratio enough on its own? | No. Combine it with Sortino ratio, rolling returns, alpha, beta, and active weight for a complete risk picture. |
Is this investment advice? | No. Education only. For personalised recommendations, consult a SEBI-registered investment advisor (RIA). |
Section 1
What is Sharpe ratio and why smart investors rely on it
The Sharpe ratio has a simple message: how much extra return did your portfolio deliver for each unit of risk you took, after removing what you could have earned risk-free?
Formula
Sharpe Ratio = (Portfolio Return − Risk-Free Return) ÷ Standard Deviation of Portfolio Returns
In plain words: remove what you could have earned in government securities (the "risk-free" rate), then divide the remaining "excess" return by the portfolio's volatility. The result tells you how efficiently the fund converted risk into reward.
Section 2
How Sharpe ratio fits into your mutual fund investment decisions
Most investors look at past 1, 3, or 5-year returns and pick the "top" fund. That approach ignores volatility and can hurt you in the next market correction. Sharpe ratio adds a risk lens to your decision-making.
For SIP investment strategies, this matters even more. Because you invest every month, a fund with a better Sharpe ratio typically gives more stable compounding — which is psychologically easier to stick with during market stress.
Compare funds within the same category — large cap vs large cap, mid cap vs mid cap
Prioritise options that deliver better risk-adjusted returns, not just higher raw returns
Cross-check whether a star performer took excessive risk to get there
Section 3
Sharpe ratio formula explained with a simple example
Fund A
Annualised return12%
Risk-free rate6%
Standard deviation10%
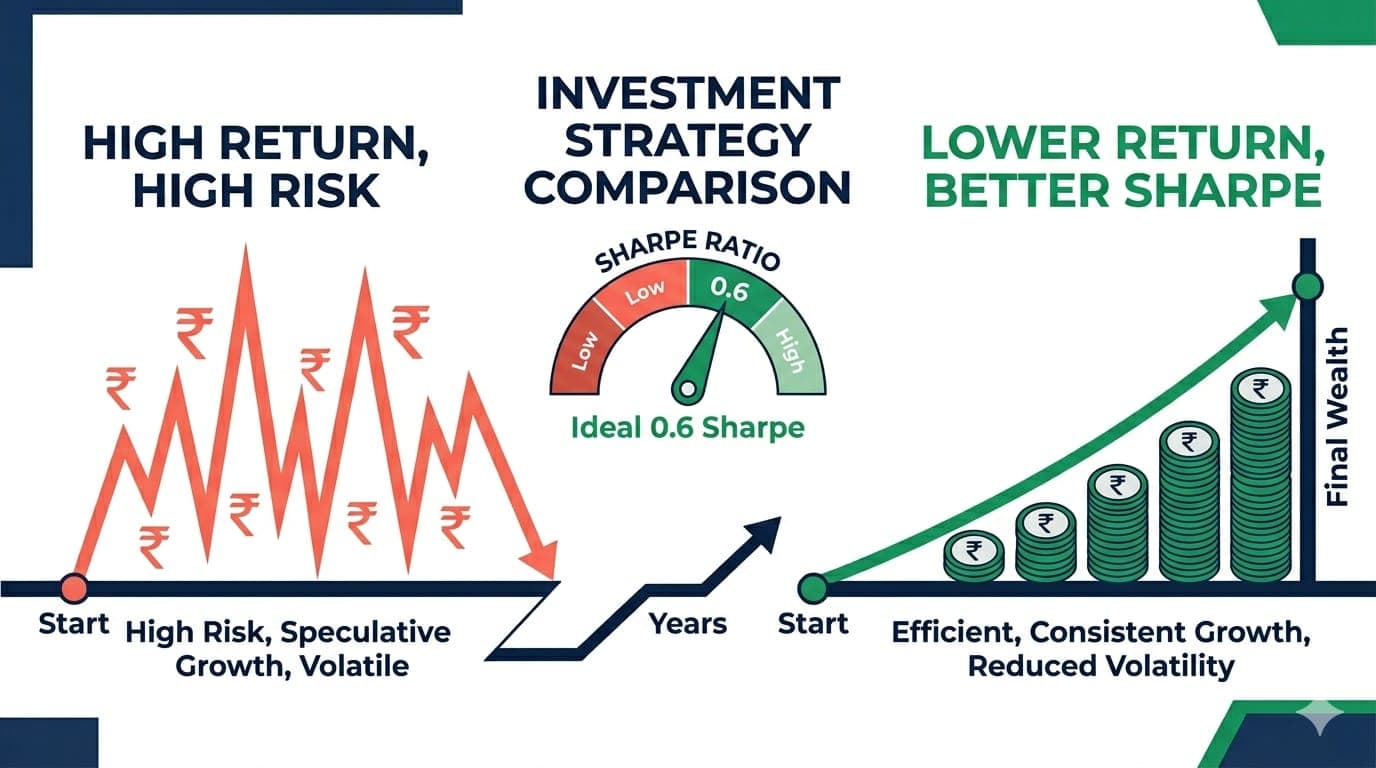
Sharpe ratio(12−6)÷10 = 0.60
Lower raw return, but better risk efficiency
Fund B
Annualised return14%
Risk-free rate6%
Standard deviation16%
Sharpe ratio(14−6)÷16 = 0.50
Higher raw return, but worse risk per unit of return
Even though Fund B gave higher raw returns, Fund A did a better job of converting risk into returns. This is exactly how professional portfolio managers think — they focus on risk-adjusted returns, not the highest number on the chart.
Section 4
What is a good Sharpe ratio for mutual funds and SIP portfolios?
< 0.3
Weak risk-adjusted performance
0.3–0.6
Average to reasonable
0.6–1.0
Strong
> 1.0
Very strong — especially over 5+ years
These are reference points, not rules. For SIP investment, consistency matters more than a single high Sharpe in a lucky year — which is why rolling Sharpe ratio (calculated monthly across multiple 3-year windows) is more meaningful than a snapshot number.
Did you know
For diversified multi-factor strategies, Sharpe ratios over 20-year horizons have been about 0.52 for the U.S. market, 0.53 for Developed ex-US, and 0.58 for Global allocations — useful real-world benchmarks for long-term expectations.
Section 5
Sharpe ratio vs other risk metrics: Sortino, alpha, beta and more
Metric | What it tells you | When to use it |
|---|---|---|
Sharpe ratio | Return per unit of total volatility (up and down) | Initial comparison across funds in same category |
Sortino ratio | Return per unit of downside volatility only | Better for equity funds where downside hurts most |
Alpha | Excess return over what the fund should have delivered given its risk | Tests genuine active management value |
Beta | Sensitivity to market movements | Understanding how aggressively a fund swings with the index |
Rolling returns | Performance across multiple overlapping periods | Tests consistency — not just one lucky period |
Combine Sharpe ratio with Sortino ratio, alpha, beta, and rolling returns and your mutual fund portfolio analysis becomes significantly deeper and more reliable than any single number alone.
Section 6
Sharpe ratio and direct vs regular mutual funds
The underlying portfolio is usually the same for both direct and regular plans — but the cost structure differs. Since Sharpe ratio uses the net portfolio return, a direct fund with a lower expense ratio will often show a slightly better Sharpe ratio than its regular counterpart, assuming identical volatility.
Costs drag returns every year — which indirectly depresses Sharpe ratio over time. This is one reason informed investors compare expense ratios carefully alongside risk-adjusted return metrics.
This is educational context — not a recommendation to choose direct vs regular mutual funds. For personalised advice on which option suits your situation, consult a SEBI-registered investment advisor.
Section 7
Sharpe ratio in practical portfolio analysis: asset allocation and active weights
At the portfolio level, Sharpe ratio helps you judge whether your overall asset allocation is efficient. It captures how your mix of equity, debt, gold, and international funds is working together — not just each fund in isolation.
Many investors hold multiple schemes that look different by name but are very similar by portfolio. Using active weight calculations and Sharpe ratio together, you can see if your "diversification" is actually improving risk-adjusted returns — or just adding complexity at a higher cost.
Did you know
A broad-market benchmark like the S&P 500 has recently shown Sharpe ratios around 0.90–0.91 for 1-year horizons, with longer-term values generally below 0.85–0.87. Beating that consistently is the real test for active fund managers.
Section 8
Sharpe ratio for SIP investment strategies and goal planning
For 10, 15, or 20-year SIPs, your biggest risk is not short-term volatility alone — it is your own ability to stay invested through drawdowns. Funds with better Sharpe ratios usually experience smaller drawdowns and smoother journeys, which helps you stay disciplined over long periods.
Using rolling Sharpe for long-term SIPs
Rolling Sharpe ratio — calculated monthly across 3-year windows for the last 10 to 15 years — shows how stable the risk-adjusted performance has been across different market cycles. A fund with consistently high rolling Sharpe ratios is far more reliable than one with a high recent number and inconsistent history.
Section 9
What your financial advisor probably never told you about Sharpe ratio
Sharpe ratio has limitations that many investors never hear about — and understanding them makes you a more informed participant in any portfolio discussion.
Time frame sensitivity: A fund can look excellent on 3-year Sharpe but average on 10-year Sharpe
Category differences: Comparing Sharpe ratio across very different asset classes (equity vs debt) can be misleading
Hides tail risk: Funds that take rare but large risks may show an attractive Sharpe during quiet periods — then fall sharply in crises
Symmetry assumption: Sharpe treats upside and downside volatility as equally "bad" — which is why Sortino ratio is often more relevant for equity investors
Section 10
How the live mutual fund workshop teaches Sharpe ratio with Goldman Sachs experience
The live, interactive mutual fund workshop is led by an instructor with Goldman Sachs experience and exposure to ₹65,000 crore+ in AUM. Focused time is spent on Sharpe ratio, risk-adjusted returns, and real case studies — so you can apply these concepts to your own portfolio analysis the same week.
How to interpret Sharpe ratio for equity, debt, and hybrid funds in the Indian context
How to use Sharpe alongside rolling returns, Sortino ratio, alpha, beta, and active weights
How to read fund factsheets and understand the quality of risk-adjusted returns
How to discuss Sharpe ratio with your SEBI-registered investment advisor more confidently
All content is educational, aligned with SEBI guidelines, and not a substitute for personalised advice. For individual recommendations, always consult a SEBI-registered investment advisor (RIA).
Conclusion
The Sharpe ratio changes the question you ask about every fund
The Sharpe ratio will not predict the future — but it will change how you see the past. Instead of chasing the highest return chart, you start asking a better question: "How much risk did this fund take to deliver those returns?"
For your mutual fund investment journey, especially if you rely on SIP strategies to reach long-term goals, that shift in thinking can make a significant difference. It helps you stick to plans, evaluate funds more objectively, and have more informed conversations with your SEBI-registered advisor.
enjoyed this article?
explore more insights on building wealth.