NAV in mutual funds: what your advisor never clearly explained about unit prices, SIPs and real returns
NAV is the most quoted number in mutual funds — yet most investors misunderstand it. Learn what NAV really means, why low NAV is a myth, how it affects SIP unit averaging, and how to use alpha, beta & Sortino ratio to make NAV work for you.
NAV is the single most quoted number in mutual fund investment — yet most investors are never taught how it really works. Mutual funds globally managed over $29.11 trillion in assets as of January 2025, much of it invested by people who only partially understand the number they transact at every day.
Key takeaways
At a glance
Question | Short answer |
|---|---|
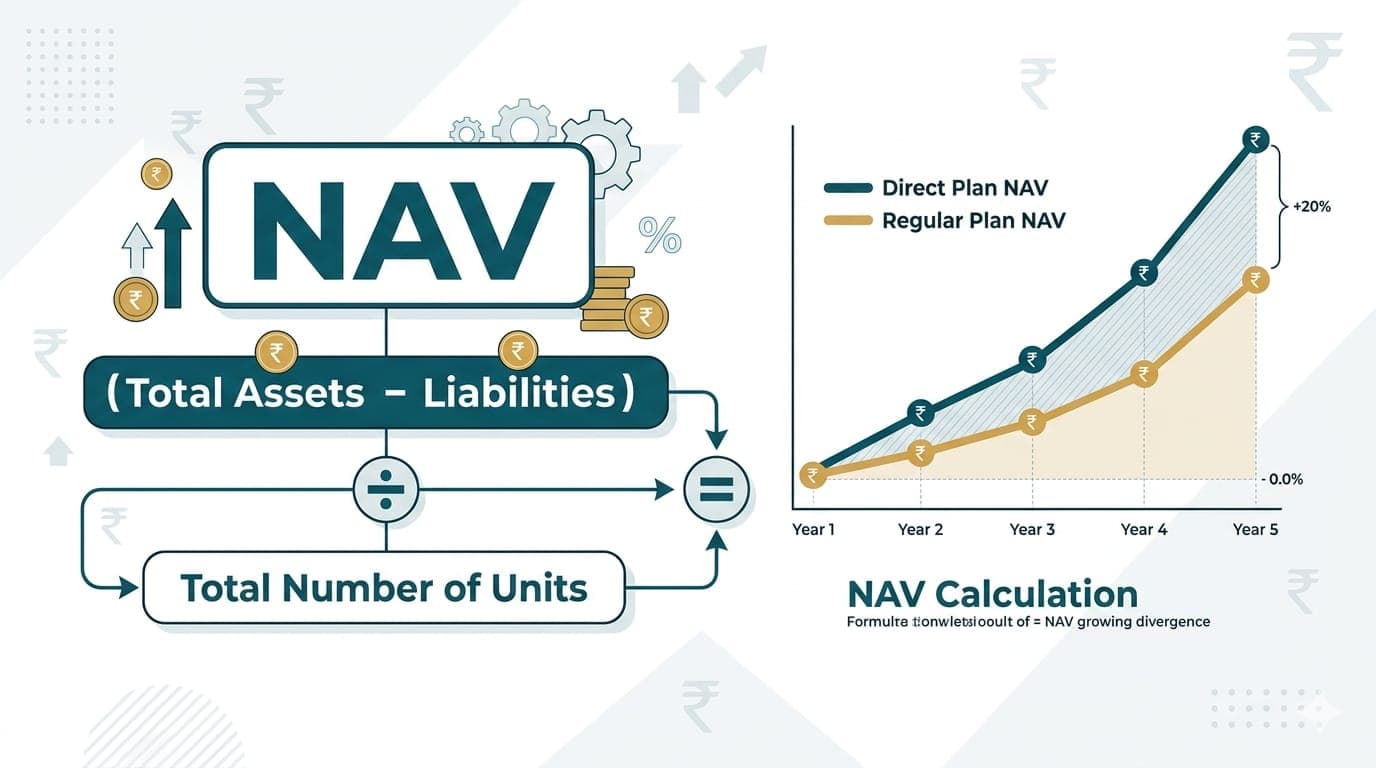
What is NAV in a mutual fund? | The per-unit value of a scheme, calculated as (Total Assets − Liabilities) ÷ Total Units Outstanding. It is the price you buy and sell at. |
Does a lower NAV mean the fund is cheaper? | No. NAV reflects per-unit value, not whether a fund is "cheap." Performance, portfolio quality, and risk-adjusted returns matter far more. |
How does NAV affect SIP investment? | You buy more units when NAV is low and fewer when it is high. Long-term wealth depends on NAV growth over time — not the starting level. |
Direct vs regular plans — how does NAV differ? | Direct plans have lower expense ratios, so their NAV compounds faster over time. The underlying portfolio of both plans is identical. |
Is this investment advice? | No. Education only. For personalised advice or fund recommendations, consult a SEBI-registered RIA. |
Section 1
NAV in mutual funds: simple definition with a professional lens
When you buy or sell a mutual fund, the price you transact at is its NAV — not a market price like a stock. NAV is calculated at the end of each business day based on the market value of the scheme's portfolio, minus liabilities, divided by the number of units. In India, this daily calculation and disclosure follow SEBI guidelines, ensuring uniformity across all asset management companies.
For you as an investor, NAV is the operational link between your money and the underlying portfolio. When you invest through SIP or lump sum, your money is converted into units using that day's applicable NAV. The real story lies in how that NAV moves over time and how it behaves through full market cycles.
Section 2
How NAV is calculated: assets, liabilities and units explained
NAV = (Market value of securities + Accrued income + Other assets − Liabilities and expenses) ÷ Total units outstanding
Every component matters. Securities include equities, bonds, money market instruments, and cash. Liabilities include management fees, registrar charges, and other accrued expenses. SEBI guidelines specify valuation norms for different asset classes to keep NAV calculations consistent across all funds.
For equity-oriented schemes, daily market prices drive NAV movement. For debt funds, mark-to-market and amortisation rules apply depending on the maturity segment. Understanding these mechanics helps you judge how "true" or "smoothened" a reported NAV actually is.
Section 3
NAV myths: why low NAV does not mean cheap or better
One of the most common myths in mutual fund investment is that a fund with a lower NAV is "cheaper" or has more "upside." This thinking comes from stock investing — where a lower share price can feel more affordable. In mutual funds, that logic is wrong.
Myth
"Low NAV fund is cheaper, so I'll get more units and higher returns."
Reality
If two funds have identical portfolios, your percentage return is the same regardless of NAV level.
A fund with NAV of ₹15 and another at ₹150 with the same portfolio will give you identical percentage gains. What matters is the fund's strategy, risk-adjusted returns, and how sustainably it compounds its NAV over time — not the absolute number.
Did you know
In 2024, the simple average expense ratio for equity mutual funds was 1.10%, while the asset-weighted average was only 0.40% — showing that most investor money is already concentrated in relatively low-cost funds.
Section 4
NAV and SIP investment: how unit averaging really works
When you invest through SIP, you commit a fixed amount every month and the number of units you receive depends on the prevailing NAV. Low NAV → more units. High NAV → fewer units. Over time, this creates an averaging effect on your cost per unit — which is why SIP investment works well for volatile markets.
The mistake many investors make is chasing "low NAV" schemes when starting a SIP, assuming more units means higher returns. What matters is not the number of units — it is the growth in NAV and the power of compounding. Whether your SIP started at an NAV of ₹20 or ₹200 is irrelevant if the long-term consistency of performance is strong.
Section 5
NAV and risk: using volatility and drawdowns in mutual fund risk analysis
NAV alone does not tell you about risk — but the way NAV behaves over time tells you everything. Mutual fund risk analysis begins when you evaluate how volatile the NAV is, how deep drawdowns are during corrections, and how quickly the fund recovers.
Rolling returns: Calculate NAV performance over multiple overlapping windows to see real consistency
Sortino ratio: Measures downside NAV volatility specifically — more relevant than Sharpe for long-term investors
Standard deviation: Shows overall NAV fluctuation around the average return
Maximum drawdown: The worst peak-to-trough NAV fall in a given period
These tools turn the daily NAV update from a random number into a meaningful risk signal that feeds directly into your fund selection process.
Section 6
NAV, alpha, beta and active weight: professional-grade portfolio analysis
Professional fund managers do not just look at absolute NAV levels. They compare NAV movements against benchmarks and peers to extract meaningful metrics.
Metric | What it reveals about NAV behaviour |
|---|---|
Alpha | How much extra return the fund delivered over its benchmark after adjusting for risk |
Beta | How sensitive the fund's NAV is to market movements — higher beta means bigger NAV swings |
Active weight | How much the fund deviates from benchmark in stock/sector allocation — low active weight suggests NAV hugs the index |
If a fund claims to be "active" but its active weights are minimal, its NAV is likely to closely track the index — which raises questions about whether the fees are justified.
Did you know
By end of 2024, equity mutual funds with expense ratios in the lowest quartile already held about 81% of equity mutual fund assets — investors increasingly favour cost-efficient strategies where NAV grows faster net of fees.
Section 7
Direct vs regular mutual funds: how cost affects NAV growth
Direct and regular plans of the same scheme hold an identical portfolio — but their NAVs diverge over time. Direct plans have a lower expense ratio because no distributor commission is embedded, so more returns are retained inside the scheme and reflected in NAV growth.
Over years, a 0.5% to 1% expense difference compounds meaningfully. In portfolio analysis tools, this shows up as a visibly higher NAV in the direct plan versus the regular plan for the same scheme — even though every stock and bond held is identical.
If you need ongoing guidance, a SEBI-registered RIA or fee-only planner can add value that goes far beyond the cost gap between direct and regular plans. The decision is not just about cost — it is about what support you need.
Section 8
NAV in debt funds and hybrid funds: what changes compared to equity
In equity funds, NAV tends to be visibly volatile because stock prices move every day. In debt and hybrid funds, NAV movement appears smoother — but that does not mean there is no risk. Interest rate moves, credit events, and duration risk all show up gradually in the NAV of a debt fund.
For debt funds, category-appropriate metrics matter most: portfolio quality, Macaulay duration, and interest rate sensitivity. For hybrid funds, focus on how NAV behaved during past crises using rolling returns and drawdown analysis — since the equity-debt blend determines NAV sensitivity to different market conditions.
Section 9
From NAV to real-life decisions: using risk-adjusted returns
Your goal is not to admire a fund's NAV — it is to take better decisions about where to invest, when to rebalance, and how much risk to take. Risk-adjusted returns are the bridge between raw NAV data and actionable investment decisions.
A professional-grade approach combines rolling returns over 3, 5, and 7 year windows, studying how often a fund's NAV has beaten its benchmark, paired with alpha, beta, Sortino ratio, and drawdown statistics. This holistic view applies whether you are managing your own SIPs for retirement or evaluating a portfolio for a financial goal years away.
Section 10
Learning NAV and mutual funds in a live, interactive workshop
Reading about NAV is useful — applying these concepts to real portfolios is where confidence actually grows. The live, interactive mutual fund workshop walks you through actual factsheets, explains SEBI guidelines around valuation and disclosure, and shows how to run portfolio analysis in spreadsheets step by step.
Compute rolling returns, Sortino ratio, alpha, beta, and active weights on sample funds
See how the NAV series of two competing funds tells completely different risk stories
Understand how direct vs regular NAV divergence builds over 10 to 15 years
Ask questions in real time — batch sizes are kept limited for meaningful interaction
The instructor has worked on Goldman Sachs strategies and managed or overseen portfolios with more than ₹65,000 crore in AUM — bringing institutional depth into practical retail-focused financial education.
Section 11
Money-back guarantee, compliance and when to consult a SEBI-registered RIA
The workshop comes with a clear money-back guarantee. If you attend live, complete the exercises, and still feel you did not get practical value in NAV analysis, SIP strategies, and risk analysis — a full refund can be requested within the specified window.
All content follows SEBI guidelines for financial education. No personalised recommendations, model portfolios, or stock tips are provided. For any fund selection, asset allocation, or financial plan tailored to your specific goals and risk profile, work with a SEBI-registered Investment Adviser (RIA).
Many workshop participants use these frameworks to have better quality conversations with their RIAs — which is exactly the kind of empowerment the sessions aim for.
Conclusion
NAV as a tool, not a trick
NAV in mutual funds is not a magic number, and it is not a shortcut to identifying "cheap" or "expensive" schemes. It is simply the per-unit reflection of a fund's underlying portfolio on a particular day, governed by SEBI valuation rules. What matters for your financial freedom journey is how that NAV behaves over years, how consistent the risk-adjusted returns are, and whether the fund's strategy genuinely adds value beyond its benchmark and costs.
When you learn mutual funds with a structured approach built around rolling returns, Sortino ratio, alpha, beta, active weight, and thorough portfolio analysis — NAV becomes a powerful tool instead of a source of confusion. Our role is to equip you with these skills through transparent, practical financial education so you can pursue financial freedom with clarity and confidence.
enjoyed this article?
explore more insights on building wealth.