Mutual fund returns explained: what your advisor never told you about beating average performance
The average equity investor earned 16.54% in 2024 while the S&P 500 delivered 25.02% — an 8.48% behaviour gap. Learn why most investors misread mutual fund returns, how to use rolling returns, Sortino ratio & risk-adjusted analysis to close that gap.
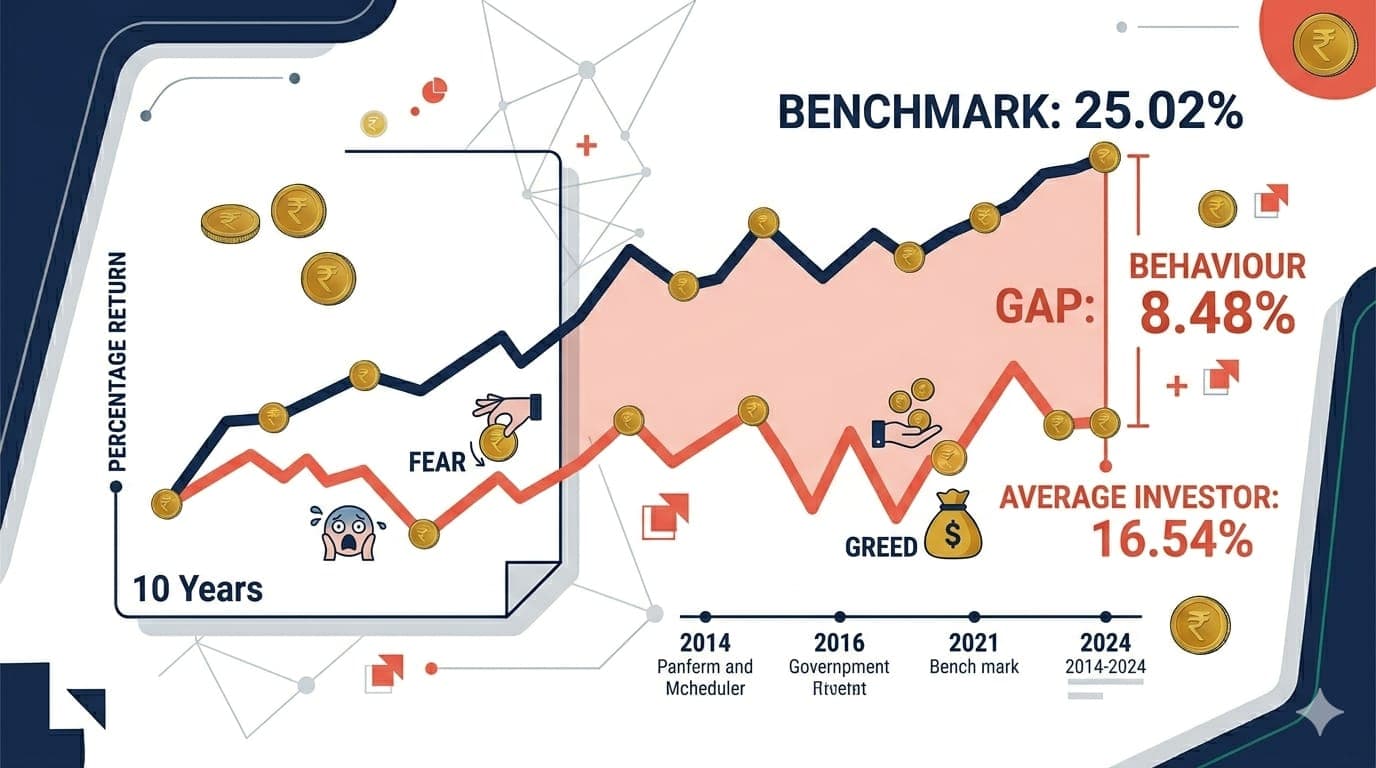
DALBAR's 2024 report shows the average equity investor earned 16.54% while the S&P 500 delivered 25.02% — an 8.48 percentage-point gap driven largely by behaviour, poor fund selection, and misunderstanding of risk. The difference between average and confident investors is not access to products. It is how deeply they understand how mutual fund returns really work.
8.48%
The behaviour gap — average equity investor return vs S&P 500 return in 2024. Most of this gap is self-inflicted through poor timing, fund selection, and reaction to volatility.
Key takeaways
At a glance
Question | Answer |
|---|---|
How do mutual fund returns really work? | They combine price appreciation, dividends or interest, and capital gains — minus expenses. Your personal return also depends on when you enter, exit, or pause SIPs. |
How should I evaluate returns beyond 1-year? | Use rolling returns, risk-adjusted returns, and downside risk — not just point-to-point CAGR numbers on a factsheet. |
Is SIP enough to get good returns? | SIP is a powerful discipline tool but returns still depend on fund selection, risk level, and holding period. Don't invest blindly. |
How do costs affect final returns? | Expense ratios and commission structures quietly reduce net returns. Direct plans can preserve more of your returns over long horizons. |
Is this investment advice? | No. Financial education only. For personalised recommendations, consult a SEBI-registered RIA. |
Section 1
What are mutual fund returns and why most investors misread them
When most people check mutual fund returns, they only look at 1-year, 3-year, or 5-year percentages on a factsheet. This narrow view ignores how volatile those returns were, how much risk the fund took, and whether those numbers are even sustainable.
Mutual fund investment decisions must start with understanding what those returns represent. They combine market movements, fund manager decisions, and your own behaviour — when you enter, exit, or pause SIPs. That is why two investors in the same fund often end up with very different outcomes.
Section 2
Types of mutual fund returns every investor should know
Absolute return
Total percentage gain from investment to current value — useful for short periods but misleading across different time spans
Annualised return (CAGR)
Compound annual growth rate — the standard for comparing funds across different periods, but still a point-to-point number
Rolling returns
Returns calculated across multiple overlapping windows — reveals consistency across different market phases, not just one period
Risk-adjusted returns
Returns measured per unit of risk taken — Sortino ratio, Sharpe ratio, alpha. The most meaningful metric for long-term investors.
Section 3
Performance analysis: beyond basic returns and star ratings
Star ratings and recent 1-year performance are backward-looking and tell you nothing about how consistent or risky those returns really were. As SPIVA and Morningstar data repeatedly show, past outperformance rarely persists over 10 years once fees are included.
Rolling returns show how a fund behaved across multiple periods — not just one convenient start and end date. Risk-adjusted analysis shows whether lower volatility and better downside protection might matter more than chasing the highest historical numbers.
Did you know
65% of U.S. large-cap funds underperformed the S&P 500 in 2024 — highlighting how relying on star ratings and recent performance alone often leads to disappointing long-term results for investors who switch into last year's winners.
Section 4
Risk-adjusted returns: using Sortino, alpha and beta like a professional
Two funds with the same 10-year return can have very different risk profiles. This is where Sortino ratio, alpha, and beta move from theory into practical decision-making tools.
Metric | What it tells you | Why it matters for returns analysis |
|---|---|---|
Beta | How much the fund moves relative to the market | High beta in a core holding means your returns will be amplified in both directions |
Alpha | Value added or destroyed versus benchmark after risk adjustment | Reveals if higher returns came from genuine skill or just taking more risk |
Sortino ratio | Return per unit of downside volatility only | Focuses on the volatility that actually hurts investors emotionally and financially |
Rolling returns | Consistency across different market entry points | Eliminates lucky timing bias — shows the real experience across all investors |
Section 5
Goldman Sachs-style strategies applied to retail mutual fund portfolios
The workshop instructor brings experience working on strategies linked to more than ₹65B AUM using Goldman Sachs-style institutional processes. Those techniques are translated into practical tools you can use for your own portfolio analysis — without complex software or a quant background.
Professional teams use factor analysis, active weight calculations, and risk budgeting to understand why a portfolio behaves the way it does. Even a simplified version of these approaches gives you a significant edge over rule-of-thumb investing.
Important: These methods are shared strictly for educational purposes — not individualised investment advice. For implementation suited to your unique situation, consult a SEBI-registered RIA.
Section 6
SIP investment strategies and their impact on long-term returns
SIP investment is often sold as a magic solution for wealth creation. While SIPs help you average costs and maintain discipline, they do not guarantee high returns. The quality of the underlying fund, your time horizon, and how you behave in volatility still drive the outcome.
Evaluating SIP investment strategies using rolling SIP returns — not just lump sum data — shows how consistent your wealth building would have been if you had started SIPs at different points in time, including before market crashes or during bull markets.
Compare SIP vs lump sum outcomes using real historical rolling data for your chosen fund categories
Test different SIP durations (5, 10, 15 years) to align strategy with your specific goal timeline
Understand how increasing SIP amounts over time (step-up SIPs) can meaningfully enhance long-term corpus
Section 7
Direct vs regular mutual funds: how costs quietly eat into returns
Expense ratios, distributor commissions, and exit loads may look small annually — but over 15 to 20 years they can significantly reduce your final corpus. When everything else is equal, lower fees leave more return in your hands.
Did you know
Lower-cost active funds outperformed their passive peers over 10 years in 28% of cases — compared with just 17% for the most expensive funds. Fees directly and measurably influence long-term mutual fund returns.
Section 8
Portfolio construction: combining funds for smoother, more reliable returns
Chasing top-performing funds individually is very different from building a resilient portfolio. True financial freedom comes from combining equity, debt, and hybrid mutual funds in a way that matches your goals, time horizon, and risk tolerance — not from owning the most recently successful fund.
A sound portfolio construction framework looks at how different funds interact, not just how they perform in isolation. Correlation, active weight calculations, and risk contribution analysis help you build a portfolio that reduces volatility while keeping return potential aligned with your objectives.
Use equity funds for long-term growth and inflation protection
Use debt and liquid funds for stability and shorter-term or emergency needs
Rebalance periodically — so your risk level does not drift away from your original comfort zone after market moves
Section 9
Hidden costs and behavioural traps that kill your mutual fund returns
Even a well-designed portfolio can deliver poor results if hidden costs and behavioural mistakes are not controlled. The 8.48 percentage-point investor behaviour gap in DALBAR's 2024 study is almost entirely self-inflicted.
Frequent fund switching
Each switch may trigger exit loads and tax events — and usually happens at exactly the wrong time (selling low, buying high)
Chasing recent performance
Investing in last year's top fund after it has already rallied is one of the most reliable ways to buy high and experience the subsequent correction
Panic selling during corrections
Exiting during a drawdown locks in losses and ensures you miss the recovery — which historically happens faster than most investors expect
Ignoring exit loads
Loads of 1% on short-term redemptions seem small but represent a meaningful drag when you switch funds frequently across a large portfolio
Practical checklists and a monthly portfolio audit routine help you build rules for your own decision-making — so emotional reactions to volatility don't override your long-term plan.
Conclusion
Better understanding leads to better returns — not better fund picking alone
Mutual fund returns are not just about picking a "good" fund and waiting. They depend on understanding what you own, controlling costs, managing risk-adjusted exposure, and maintaining the behavioural discipline to stay invested through full market cycles.
When you learn to use rolling returns, Sortino ratio, alpha and beta, and active weight analysis — and combine this with a clear SIP strategy and structured portfolio reviews — you close a significant portion of the behaviour gap that separates average investors from confident, process-driven ones. For personalised advice on implementation, always consult a SEBI-registered investment advisor.
enjoyed this article?
explore more insights on building wealth.